K3PGP.Experimenter's.Corner
![]()
K3PGP.Experimenter's.Corner
![]()
Home Astronomy Bicycle Construction Laser Moonbounce Software Guest Misc Sales
Radar
Echoes from the Sun
Man's first direct contact with the sun opens new approaches for
the study of solar events.
On a number of mornings in September 1958, April l959, and September 1958, attempts were made at Stanford University to obtain radar echoes from the Sun. The data obtained on three days in April have been intensively analyzed with the aid of a digital electronic computer. It appears that solar echoes were obtained on each of these days. This experiment was possible only because of the availability of facilities built up at Stanford for several different research programs.
Equipment and Test Procedure
For the April 1959 sun-echo tests a transmitter (Collins
FRT-22) having about 40 kilowatts average output power was
operated at about 25.6 Mhz. The transmitter was pulsed on and off
alternately throughout a time interval of 15 minutes, each on and
off period lasting 30 seconds.
The antenna system used for both transmission and reception
consisted of four rhombic antennas in a broadside array, covering
a rectangular area of 800 by 725 feet. The antenna gain is
estimated to be 25 decibels relative to that of an
omnidirectional antenna. The principal antenna beam is directed
approximately east at an elevation of 10 degrees. The sun is in
the antenna beam only for about 30 minutes soon after sunrise on
a few days near each equinoctial period.
The travel time of a radar pulse to the sun (approximately 93
million miles away) and back to the earth is about 1000 seconds.
At the end of the transmitting period of 900 seconds, the antenna
was connected directly to the receiving system, and the
transmitter and pulsing circuits were turned off.
The receiver and its preamplifier are of conventional design.
An intermediate frequency bandwidth of 2000 Hz was used, and this
band was translated with the receiver beat-frequency oscillator
so that its lower end was at zero frequency. The receiver was
tuned to the transmitted frequency since the computed Doppler
shift was less than 25 Hz. The output was recorded on magnetic
tape for later detection and analysis.
Trials were scheduled for each morning from 5 to 13 April, inclusive. Because of various difficulties (for example, equipment failures, timing ambiguity, and radio interference), recordings suitable for intensive analysis were obtained only on 7, 10, and 12 April.
Data Analysis and Results
Data analysis was conducted with an IBM -797 computer and
associated equipment. The recordings made on 7, 10, and 12 April
at 0 to 2000 Hz were sampled electronically 4000 times each
second, and thus the data were converted from analog to digital
form. The absolute values of the samples were summed for periods
of one second, and these one-second sums were stored for further
analysis. (By taking absolute values, the receiver output was
detected in an ideal linear detector. ) The longest usable echo
time common to the three days is 12 minutes, or 720 one-second
sums.
A square wave of period 1 minute representing the transmitted wave, was cross-correlated with the 720 one-second sums for each day. That is the sums 1 through 30 were added, 31 through 60 were subtracted, 61 through 90 were added . . ., and 691 through 720 were subtracted to obtain one point of the cross-correlation curve. The next point was obtained by adding the sums 2 through 31, subtracting those from 32 through 61, and so on , the first one-second sum being included with the subtraction of the sums 692 through 720. After 60 cross-correlation points were obtained in this way, the values would start to repeat, so only 60 points (seconds) were computed. The cross-correlation curves that result are shown in Fig 1a - 1d.
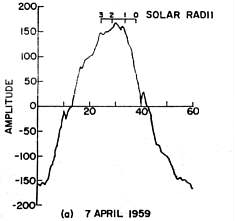
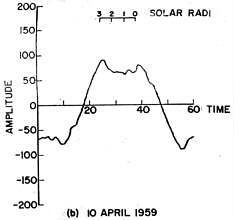
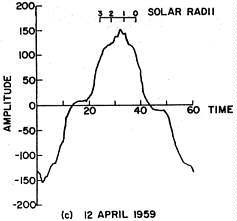
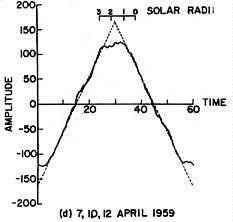
Curves a, b, and c in Fig. 1 show the cross-correlation curves for 7, 10, and 12 April, respectively, and curve d is a composite curve for the three days.
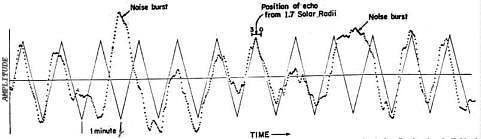
Fig. 2. Processed data
(cross-correlation of 1 minute of transmitted code with 12
minutes of received signal), showing individual echo returns and
disturbing noise bursts compared with ideal echo curve for 7
April 1959. Curve a in Fig. 1 is derived from these data. The
ordinate is relative amplitude in arbitrary units, and the
abscissa is relative time in seconds.
From a preliminary analysis of the spectrum received it appears that the echo energy is spread over at least 2000 cycles per second. Solar rotation alone could account for much of this Doppler broadening, but gross motions in the solar corona would also be expected to produce a wide echo spectrum.
Home Astronomy Bicycle Construction Laser Moonbounce Software Guest Misc Sales
Contents of this website are ©1997 - 2014 of K3PGP and of the originating authors.